

In today’s digital marketplace, data isn’t just information - it’s revenue waiting to be activated. Whether you’re a textile designer, pattern seller, or creative entrepreneur using platforms like The Pattern Cloud, understanding how to strategically interpret dashboard analytics can be the difference between steady traffic and consistent sales growth.
The key? Shifting your mindset from looking at numbers → to acting on insights.
Below is a practical guide on how to transform your analytics dashboard into a sales-generation engine.
Know Which Metrics Actually Matter
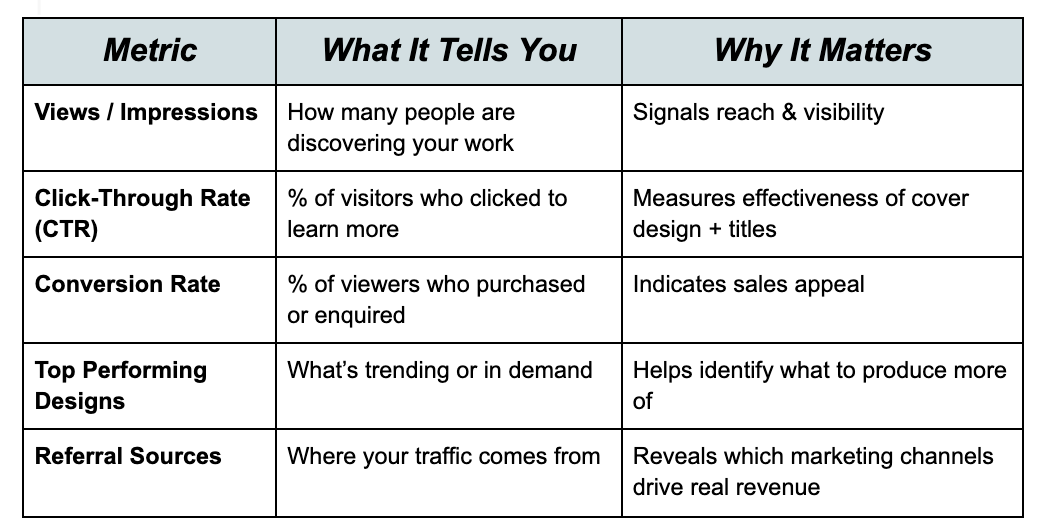
Many creators get overwhelmed by dashboard data because they track everything - but prioritize nothing. Focus on the performance indicators most connected to revenue:
Use Search & Buyer Intent to Guide New Designs
Analytics don’t just show what has sold - they predict what will sell.
Look for:
- Designs that get a lot of views but low conversions → great concept, but need improved presentation or colorways.
- Seasonal spikes → plan ahead for recurring demand.
- Search terms or tags → refine your keyword strategy to match how buyers search.
Creators often see a dramatic lift in conversions simply by matching design titles and tags more closely to buyer language.
Identify Sales Opportunities Hidden in Your Data
Here are a few strategic questions to ask when reading your dashboard:
- Which of my designs attract the most attention?
→ Double down: create similar collections or coordinated versions.
- Which designs are always “almost there”?
→ Improve thumbnails, rename, retag, or highlight in seasonal promotions.
- Which fabric/industry categories buy most from me?
→ Tailor more releases to that buyer profile.
- Which channels bring me the best quality visitors?
→ Invest your marketing energy there.
Data is a spotlight - it tells you exactly where to look for growth.
Optimise Your Portfolio Presentation
Small improvements can create big conversion jumps. Use your data to refine:
- Cover visuals / hero images - First impressions drive clicks.
- Title structure - Descriptive + relevant keywords = more searches.
- Tags - The more accurate, the better the match with buyer intent.
- Collection strategy - Designers who group or theme their patterns often see higher engagement and add-on sales.
Think of your portfolio like a digital shop window. Your analytics dashboard tells you which “displays” are working.

Create a Feedback Loop with Your Analytics
The fastest-growing creators operate on a simple cycle:
- Release / update a design
- Watch dashboard performance
- Make small improvements
- Re-test + repeat
This turns your dashboard into a live feedback system that guides every publishing decision you make.
Turn Insight into Promotion Strategy
Once you know what your buyers love most, you can use analytics to amplify sales:
- Feature high-performing designs in your social posts
- Create “You might also like” cross-promotions
- Build themed collections based on proven demand
- Run targeted email campaigns based on traffic source data
You’re no longer guessing what to market - you’re responding to demand.
Using Your Analytics Tools in The Pattern Cloud
Your Analytics Dashboard gives you a real-time overview of your studio’s performance - from design visibility to customer behavior. Think of it as your creative business cockpit: everything you need to track what’s working, all in one place.
Here’s what you’ll find on the Analytics tab:

You can also customise your landing dashboard by dragging your four preferred widgets into the display slots. This lets you focus on the metrics that matter most to your goals - whether that’s visibility, sales performance, or customer trends.
Pro Tips:
- Review your Top 5 Viewed weekly to spot design themes or color palettes that consistently perform well.
- Use Most Popular Search to update your tags and match buyer demand.
- Track Designs in Baskets to identify near-sales opportunities - a small presentation tweak might close the deal.
Your Analytics Dashboard isn’t just a report - it’s your data-powered assistant, helping you make informed decisions about what to design, when to upload, and how to sell smarter.
When used strategically, your analytics dashboard becomes more than a reporting tool - it becomes your blueprint for sales growth. Instead of reacting to performance, you’re shaping it with informed decisions that build momentum over time.
If you’re selling patterns or surface designs online, your next big sales opportunity might already be sitting in your dashboard - you just need to know how to read it.

Using The Pattern Cloud as your sales platform gives you instant access to customer insights and real-time analytics, making it easier than ever to understand what’s selling, who’s buying, and how to grow your business with data-driven decisions.